Test ride cheat sheet: ride states and statistics¶
For the first real ride with the ride state machine. On the road there is only tap, long
press and swipe. The averages are not on the display, you check them at home on
/stat/statistics.html. On the road you therefore only check what you can see, and
note the time of every action (e.g. as a voice memo on the phone).
Model: rides and statistics.
What you see¶
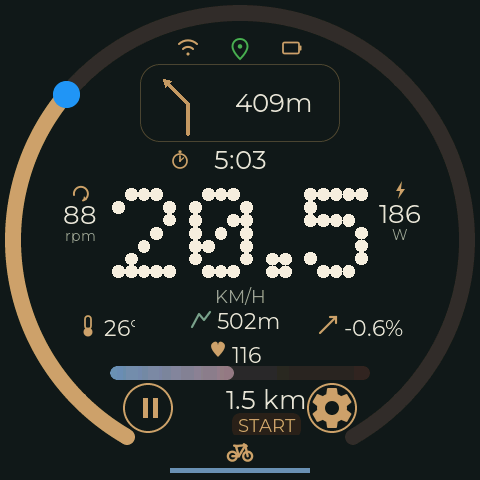
| Element | Meaning |
|---|---|
| State icon (above the road-quality line) | pedaling / coasting (ride), free ride (also cruise), stop, break (> 2 min), broken chain link (no speed sensor) |
| Button at the bottom | start arrow = currently not in ride mode, pause symbol = ride mode |
| Time widget | clock icon + time of day = no session open, stopwatch + running time = session running |
| Stopwatch value | session time with stops and breaks, without time without a sensor |
| Distance field with label | swipe left/right: START / TRIP / TOUR / TOTAL. START = current session |
| State icon colour at break / no sensor | green = auto-off is off, neutral = auto-off is on (blinks in the last minute) |
Swiping up/down changes the kind of average, but RimRidge has no widget for it yet. So you see nothing of that.
Operation¶
| Gesture | No session open | Session open |
|---|---|---|
| Tap start/pause | new session: START to 0, stopwatch from 0:00, ride mode |
toggle ride ↔ cruise, session stays open |
| Long press start/pause | ⚠ toggle auto-off (not a stop!) | end the session (stop) |
Careful: a long press without an open session switches auto-off on. You recognise that at a break by the neutral instead of green icon. A second long press switches it off again.
Preparation at home¶
- Open
/stat/statistics.htmland take a screenshot. The columns Total, Tour and Trip are the starting point. After the ride the difference must be exactly this ride. - Optionally switch on the text log on the SD card, via serial: check
showloglevel, otherwiseloglevel STAT INFO -file. ThenRide session started/stoppedandConnected/Disconnected from speed sensorare on the card with a timestamp. - Take the phone with TrailBridge along. GPS in the binary log is the independent comparison for distance and speed.
Scenarios¶
The order makes a sensible tour. On the right is what the display must show.
| # | Action | Expectation |
|---|---|---|
| 1 | Switch on, ride off without a tap | free-ride icon, start arrow, time of day (no stopwatch), START = 0.0 km. TRIP counts anyway |
| 2 | Tap while riding | pedaling icon, pause symbol, stopwatch from 0:00, START from 0 |
| 3 | Keep the legs still above 5.5 km/h (coast) | coasting icon (< 40 rpm), pedaling again above 50 rpm. The stopwatch simply keeps running |
| 4 | Traffic light, stand for < 2 min | stop icon, stopwatch keeps running. Pedaling again when moving off (> 5.5 km/h) |
| 5 | Tap while riding (cruise) | free-ride icon, start arrow, stopwatch keeps running, START keeps counting. Ride a few hundred metres, note the time |
| 6 | Stop while in cruise, tap at standstill, then move off | at standstill: stop icon, button changes to pause. When moving off: pedaling (ride), not free ride |
| 7 | Break of > 2 min | break icon after 2 min (green as long as auto-off is off). Stopwatch keeps running |
| 8 | Sensor gone: wait in the break until the speed sensor sleeps, or switch the bike computer off briefly and on again after a few hundred metres | chain-link icon. Stopwatch stands still. After the reconnect the distance jumps by the distance without a sensor |
| 9 | Long press while riding | time of day instead of stopwatch, free-ride icon, start arrow. START stays at its final value |
| 10 | Then tap | new session: START = 0, stopwatch 0:00 |
Important for scenario 8 with switching off and on: the ride session only lives in RAM. After a restart no session is open (time of day instead of stopwatch) and the ride column is empty. Tour, trip and total are kept: they are stored in NVS every 5 min, on every stop and before powering off. This is known behaviour, not a bug. So test the restart of the bike computer only at the end of the tour or after scenario 10.
After the ride, at home¶
On /stat/statistics.html:
- Difference to the screenshot in tour and trip ≈ distance ridden. Total rises by the same value.
- Ride column (last session): the moving time ("Moving") must match your notes. Stops and breaks appear separately.
- "of it cruise" (distance and time) ≈ the distance from scenario 5.
- "without sensor" ≈ the distance from scenario 8. Otherwise the value should be 0 or very small, because the first counter value after the connect ends up there.
- Averages: "Moving" ≥ "incl. stops" ≥ "incl. stops and breaks". "Ride mode only" leaves out the cruise distance from scenario 5.
- Max speed is plausible (up to 120 km/h is stored, more is discarded) and roughly agrees with GPS.
- Cadence (average while pedaling) is in the usual range, typically 60 to 90 rpm.
GPX: bikelog gpx -i L_….bin -o test.gpx --ride-states. Every change of state starts a
new <trkseg> with <bc:RideState> (ride, coasting, cruise, free ride, stop, break,
disconnected). The segments should match the times you noted.
Cross-check with the binary log (L_*.bin, reader in Tools/bikelog/): every 5 s it
contains speed, dist_m (since switching on) and GPS. Times with speed > 0 give the
moving time, the final dist_m the distance. The text log (if switched on in the
preparation) maps session start and stop as well as connect and disconnect to the times
you noted.
Known gaps you may run into¶
- Auto-off cannot be toggled while a session is open, because the long press then ends the session. By default auto-off is off at boot.
- Without a cadence sensor the icon always shows coasting in ride mode (see the design document, §7).
- A manually set total odometer value raises the total average.